Billwerk+ Optimize Logo
Billwerk+ Analyze – Your Analytics Dashboard for Pay & Optimize

Our Analyze solution provides you with your most important KPIs and helps with planning and forecasting.

Billwerk+ Optimize Logo

Billwerk+ Analyze – Your Analytics Dashboard for Pay & Optimize

Our Analyze solution provides you with your most important KPIs and helps with planning and forecasting.

Billwerk+ Optimize & Pay screenshots of the Analyze data dashboard and graphics

With our intuitive, transparent and ever-evolving KPI overview, you can track your revenue, payment and other goals, set alerts and export any data you need for deep dives.

With our intuitive, transparent and ever-evolving KPI overview, you can track your revenue, payment and other goals, set alerts and export any data you need for deep dives.

4000+ customers are growing with Billwerk+

RTL+
Bedrock Logo
DSB Logo
Danske Spil - Logo_billwerk+
Interflora - Logo billwerk+
matas - Logo billwerk+

4000+ customers are growing with Billwerk+

Our Power Features

Our Power Features

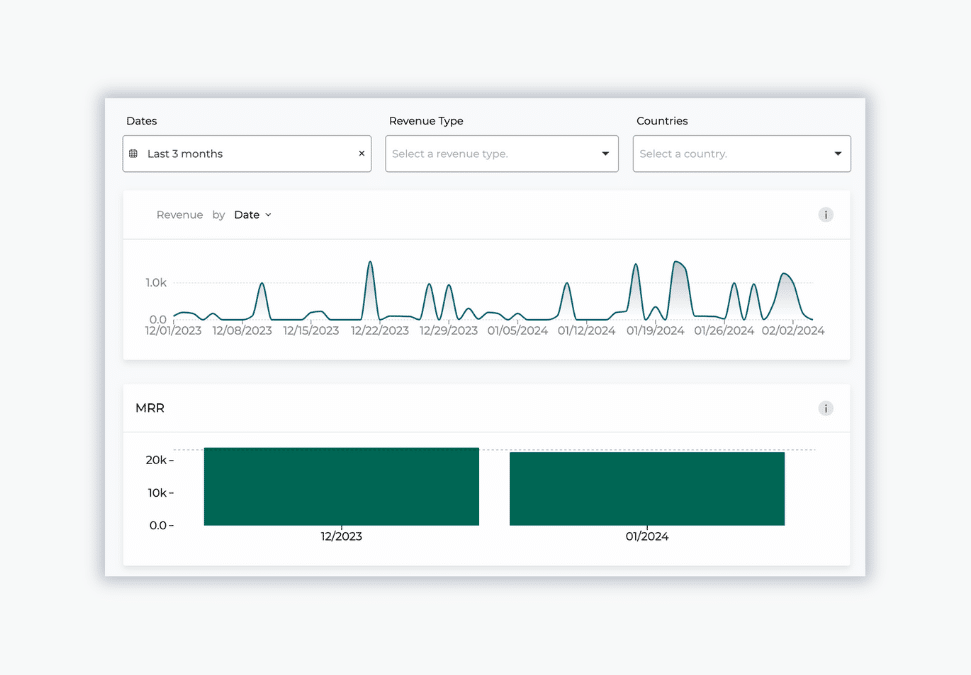
Revenue Dashboard

Analyze provides you with the most important KPIs to track your recurring and single revenue goals.

  • Revenue per date/month/quarter/year
  • Average ARR (Annual Recurring Revenue)
  • Average MRR (Monthly Recurring Revenue)
  • MRR Movement
  • Average revenue per customer
Billwerk+ Optimize & Pay screenshot of revenue graphics of the Analyze feature

Revenue Dashboard

Billwerk+ Optimize & Pay screenshot of revenue graphics of the Analyze feature

Analyze provides you with the most important KPIs to track your recurring and single revenue goals.

  • Revenue per date/month/quarter/year
  • Average ARR (Annual Recurring Revenue)
  • Average MRR (Monthly Recurring Revenue)
  • MRR Movement
  • Average revenue per customer
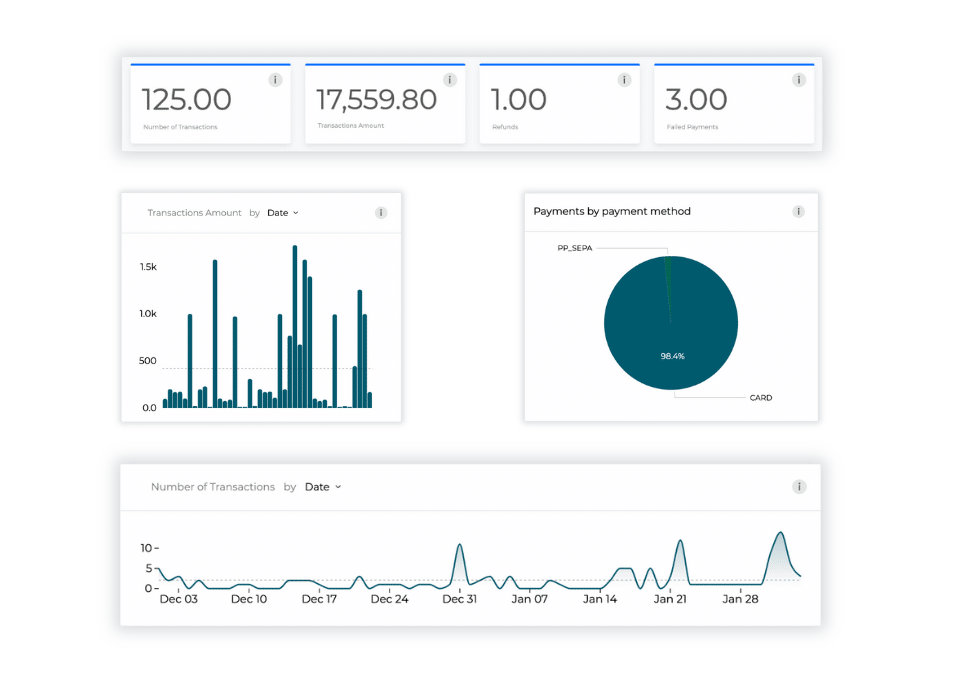
Billwerk+ Optimize & Pay screenshot of different Analyze data graphics
Payment Dashboard

Gain an overview of the amount of payments, track failed payments and more to see exactly where you can optimize your customer experiences, identify issues and increase your overall revenue.

  • Payments
  • Payment Amounts
  • Refunds
  • Failed Payments

Payment Dashboard

Billwerk+ Optimize & Pay screenshot of different Analyze data graphics

Gain an overview of the amount of payments, track failed payments and more to see exactly where you can optimize your customer experiences, identify issues and increase your overall revenue.

  • Payments
  • Payment Amounts
  • Refunds
  • Failed Payments
Filter for Deep Dives

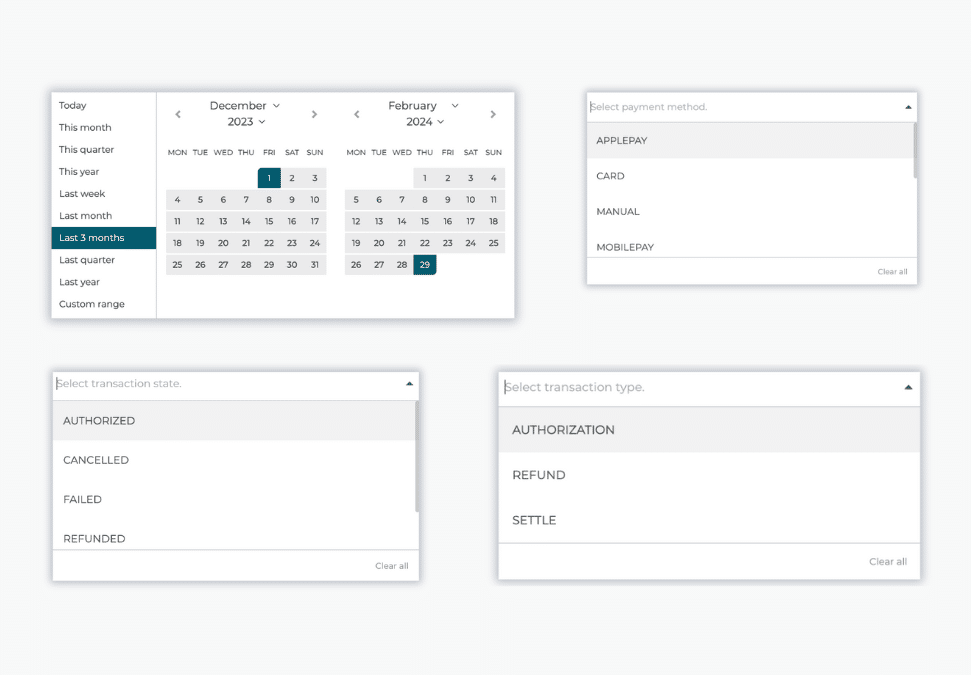
Our filters help you to slice and dice the data for a more detailed view to help you get even more insights about your revenue, customer behavior and payments.

  • Dates
  • Countries
  • Revenue Type
  • Payment methods
  • Transaction types
  • Transaction states
Billwerk+ Optimize & Pay screenshot of the Analyze filter options for the data dashboard such as date, payment methods, transaction states or transaction types

Filter for Deep Dives

Billwerk+ Optimize & Pay screenshot of the Analyze filter options for the data dashboard such as date, payment methods, transaction states or transaction types

Our filters help you to slice and dice the data for a more detailed view to help you get even more insights about your revenue, customer behavior and payments.

  • Dates
  • Countries
  • Revenue Type
  • Payment methods
  • Transaction types
  • Transaction states
Billwerk+ Optimize & Pay screenshot of Analyze data analytics alert functionality
Set your own alerts

Want to know when you hit your goal or be alerted early enough when the numbers don’t match the forecast? With our alert functionality, you have a wide variety of options to set alerts and choose the channels (and people) who should receive them.

  • Flexible triggers & categories
  • Set goals and dates
  • Define filters
  • Choose your alert channels (email, Slack, SMS or webhook)

Set your own Alerts
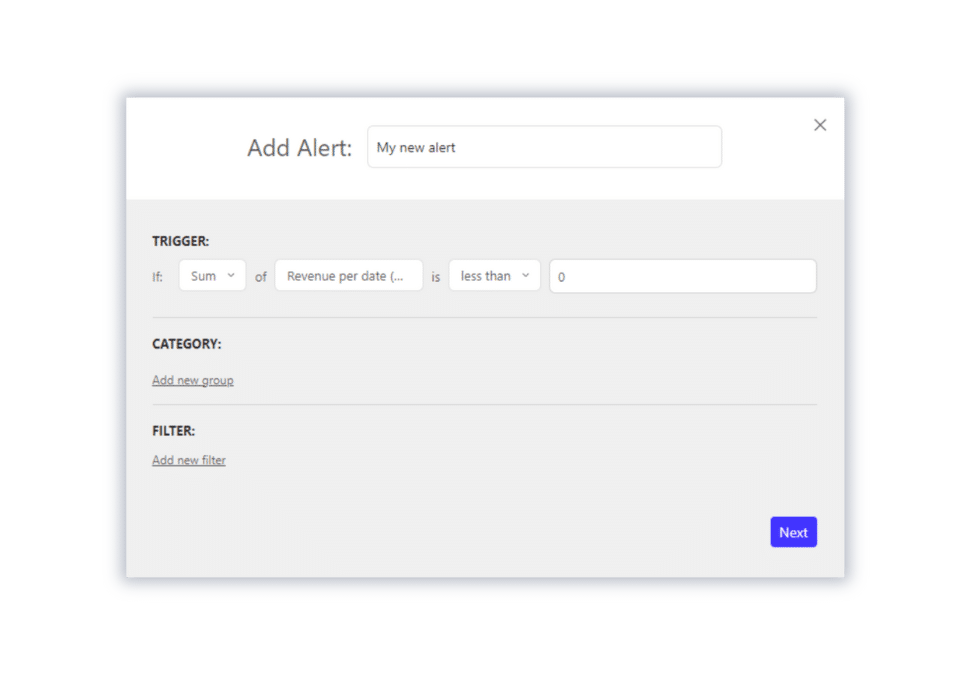
Billwerk+ Optimize & Pay screenshot of Analyze data analytics alert functionality

Want to know when you hit your goal or be alerted early enough when the numbers don’t match the forecast? With our alert functionality, you have a wide variety of options to set alerts and choose the channels (and people) who should receive them.

  • Flexible triggers & categories
  • Set goals and dates
  • Define filters
  • Choose your alert channels (email, Slack, SMS or webhook)

Seeing is believing

Seeing is
believing

How do you benefit?
The KPIs that matter

We have talked with our customers and listened closely to their feedback to get the most important KPIs for your business purposes.

Intuitive Dashboards

Our dashboards are designed to make it easy for you to see the most important numbers at a glance and filter for more granular results depending on your needs.

Full Transparency

All our calculations and KPIs are explained in the dashboard to give you full transparency on the results. Additionally, you have full access to our documentation.

Easy Filtering

To really drill into different payment options, countries, time frames, and revenue sources, we offer a wide range of filter methods.

Different Export Options

You want to share the results or download them as CSV or XLSX for further analysis? All results have an export option (PDF, PNG, CSV or XLSX).

We’re just getting started

Our Analyze team is always working on new KPI sections, functionalities and options for you to explore. So, stay tuned.

How do you benefit?

The KPIs that matter

We have talked with our customers and listened closely to their feedback to get the most important KPIs for your business purposes.

Intuitive Dashboards

Our dashboards are designed to make it easy for you to see the most important numbers at a glance and filter for more granular results depending on your needs.

Full Transparency

All our calculations and KPIs are explained in the dashboard to give you full transparency on the results. Additionally, you have full access to our documentation.

Easy Filtering

To really drill into different payment options, countries, time frames, and revenue sources, we offer a wide range of filter methods.

Different Export Options

You want to share the results or download them as CSV or XLSX for further analysis? All results have an export option (PDF, PNG, CSV or XLSX).

We’re only getting started

Our Analyze team is always working on new KPI sections, functionalities and options for you to explore. So, stay tuned.

Discover More

Discover More

A space rocket about to fly off into space
The biggest Subscription Trends 2024

Find out what our experts identified as trends, technologies, and themes that will shape the subscription market in 2024.

The biggest Subscription Trends 2024

Find out what our experts identified as trends, technologies, and themes that will shape the subscription market in 2024.